Query Builder
Functional overview
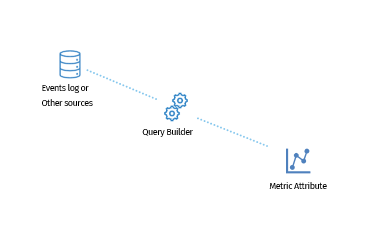
This module will help you to create easily queries on events present in AIOpsCells or external sources. The result of a query will set an attribute metric with the specified cycle. Then, you will be able to associate a graphical widget to this Attribute metric for the enrichment of your Dashboard.
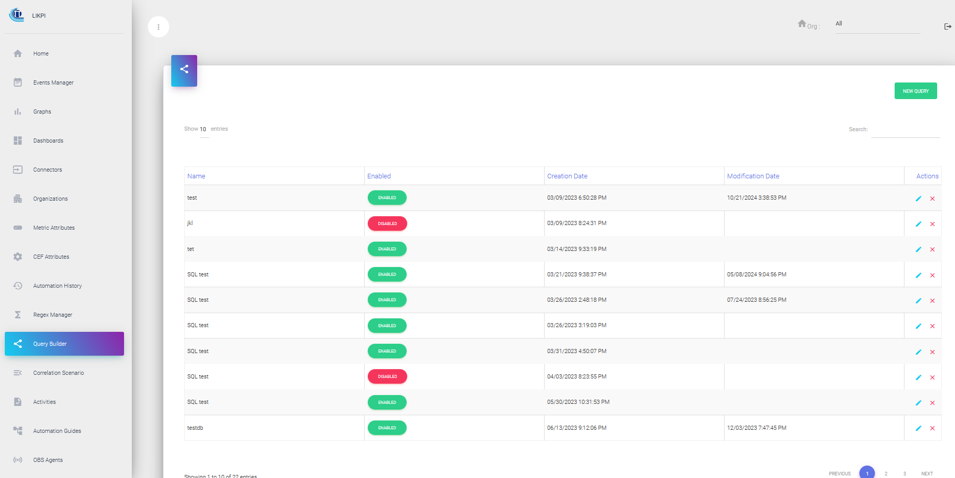
Query Builder rules list:
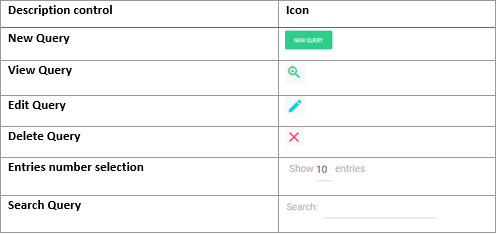
Controls description:
Create new Query
When you click on New Query, the following window is displayed:

The creation of the Query is effective at the last step with the Finish button.
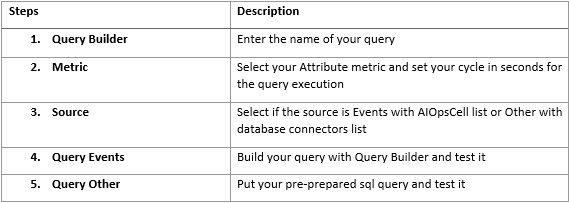
Description of process:
Note
The result of the query must be a number value.
Step 2: Metric selection and cycle
Select the metric attribute.

Note
On the Metric attribute, you need to type the first 3 letters of your attribute to have the list.
Step 3: Source selection
- Event selection with AIOpsCell.

Note
Only AIOpsCells up and running are available.
- Other selection with database connectors

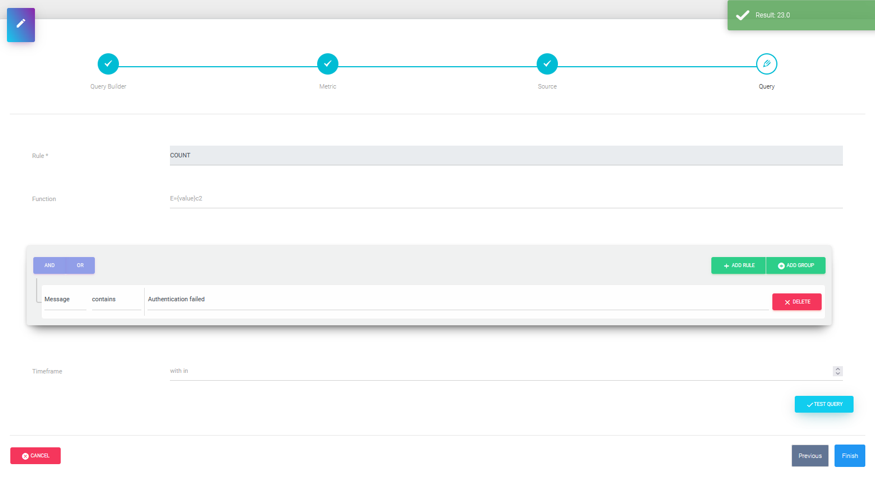
Step 4: Query
- Events query and test
- Other database query
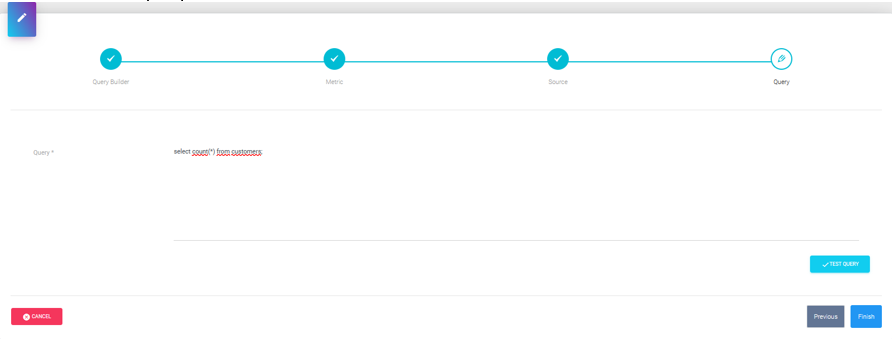
Then you save your Query rule with the button Finish.
This new query will be taken into account in real time by the metric-manager service and the Attribute metric will start to be updated.
Custom Queries to go further
Please find below a set of queries examples that you can use in Step3 (Others) with the AIOpsCell source database.
Then the metric attribute can be used in a scenario correlation and/or dashboard widget.
Note
You need to adap the queries below to return an number value in order to set any attribute metric.
Basic Log Filtering & Counting (HSQLDB)
Count CRITICAL errors
SELECT COUNT(*)
FROM EVENTS
WHERE FIELD1 = 'CRITICAL';
Find logs containing connection timeout
SELECT *
FROM EVENTS
WHERE INSTR(FIELD13, 'connection timeout') > 0
ORDER BY UUID;
Get the latest 100 WARNING logs
SELECT TOP 100 *
FROM EVENTS
WHERE FIELD1 = 'WARNING'
ORDER BY LOCAL_MIN DESC, UUID;
Count logs per severity level
SELECT FIELD1, COUNT(*)
FROM EVENTS
GROUP BY FIELD1;
Find logs between two timestamps
SELECT *
FROM EVENTS
WHERE LOCAL_MIN BETWEEN TIMESTAMP'2024-01-01 00:00:00' AND TIMESTAMP'2025-06-02 00:00:00'
ORDER BY UUID;
Advanced Filtering & Pattern Matching (HSQLDB)
Find logs with error but severity is not ERROR
SELECT *
FROM EVENTS
WHERE INSTR(LCASE(FIELD13), 'error') > 0
  AND FIELD1 NOT IN ('MAJOR', 'CRITICAL')
ORDER BY UUID;
Find logs where FIELD13 starts with Auth failed
SELECT *
FROM EVENTS
WHERE SUBSTRING(FIELD13 FROM 1 FOR 11) = 'Auth failed'
ORDER BY UUID;
Count logs per hour (time bucketing)
SELECT extract(HOUR FROM LOCAL_MIN) AS hour, COUNT(*)
FROM EVENTS
GROUP BY extract(HOUR FROM LOCAL_MIN)
ORDER BY hour;
Find logs with a numeric error code (e.g., 500)
SELECT *
FROM EVENTS
WHERE INSTR(FIELD13, ' 500 ') > 0
ORDER BY UUID;
Aggregations & Statistical Analysis (HSQLDB)
Top 5 most frequent log messages
SELECT FIELD13, COUNT(*) AS frequency
FROM EVENTS
GROUP BY FIELD13
ORDER BY frequency DESC
LIMIT 5;
Calculate error rate (CRITICAL logs / total logs)
SELECT
  SUM(CASE WHEN FIELD1 = 'CRITICAL' THEN 1 ELSE 0 END) * 100.0 / COUNT(*) AS error_rate
FROM EVENTS;
Rolling 10-minute average of logs
WITH minute_counts AS (
  SELECT extract(MINUTE FROM LOCAL_MIN) AS minute, COUNT(*) AS cnt
  FROM EVENTS
  GROUP BY extract(MINUTE FROM LOCAL_MIN)
)
SELECT
  a.minute,
  AVG(b.cnt) AS rolling_avg
FROM minute_counts a
JOIN minute_counts b ON b.minute BETWEEN a.minute - 9 AND a.minute
GROUP BY a.minute;
Find logs with unusually high frequency (anomaly detection)
WITH log_counts AS (
  SELECT FIELD13, COUNT(*) AS freq
  FROM EVENTS
  GROUP BY FIELD13
)
SELECT *
FROM log_counts
WHERE freq > (SELECT AVG(freq) * 5 FROM log_counts);
Count logs by severity per day
SELECT
  extract(DAY FROM LOCAL_MIN) AS day,
  FIELD1,
  COUNT(*)
FROM EVENTS
GROUP BY extract(DAY FROM ), FIELD1
ORDER BY day;
Mapping field for AIOpsCell database EVENTS table
You can enrich your queries with the fields below when they are used.
| Field name (Event Manager) | Mapping in EVENTS table |
|---|---|
| Severity | FIELD1 |
| Priority | FIELD2 |
| Type log | FIELD3 |
| Received | FIELD4 |
| Received Client | FIELD5 |
| Notes History | FIELD6 |
| Object | FIELD7 |
| ObjectClass | FIELD8 |
| Host | FIELD9 |
| HostAddress | FIELD10 |
| MetricType | FIELD11 |
| MetricValue | FIELD12 |
| Message | FIELD13 |
| CLASS event | FIELD14 |
| CollectorID (AIOpsCell) | FIELD15 |
| ProbeRef(ObsAgent) | FIELD16 |
| CLUSTERID | FIELD17 |
| REGEXID | FIELD18 |
| ORIGINLOGFILE | FIELD19 |

