Graphics Management
Graphics access
In the menu on the left, when you click on Graphs, the list of existing graphics appears.
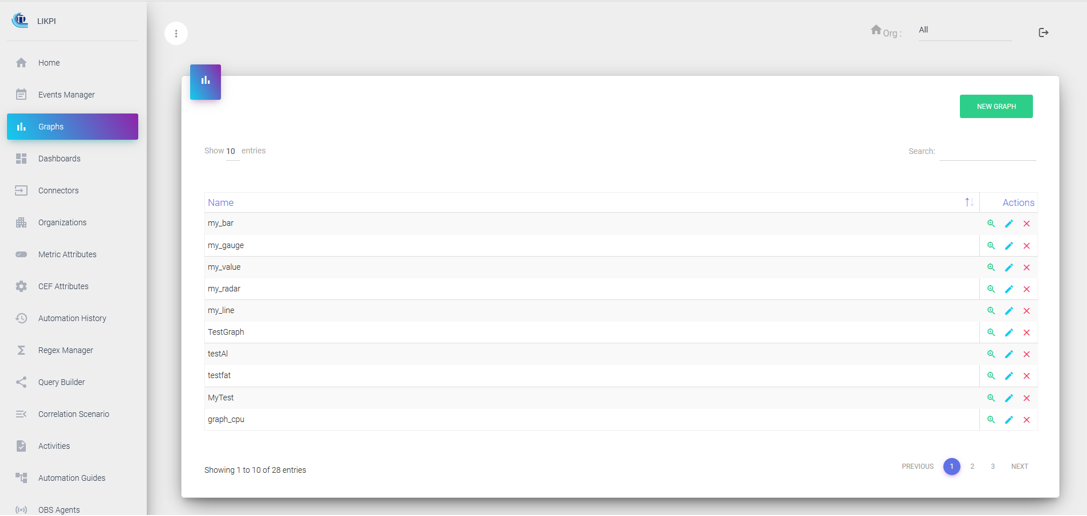
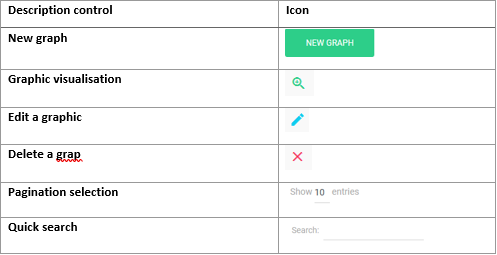
Controls description:
Graphic creation/edition
The creation of a graphic is carried out step by step until the final rendering. When you click on New Graph, the creation of a graph looks like this:

At any time, you can cancel the creation of the graph using the Cancel button. The creation of the graph is effective at the last step with the Finish button.
Description of process:

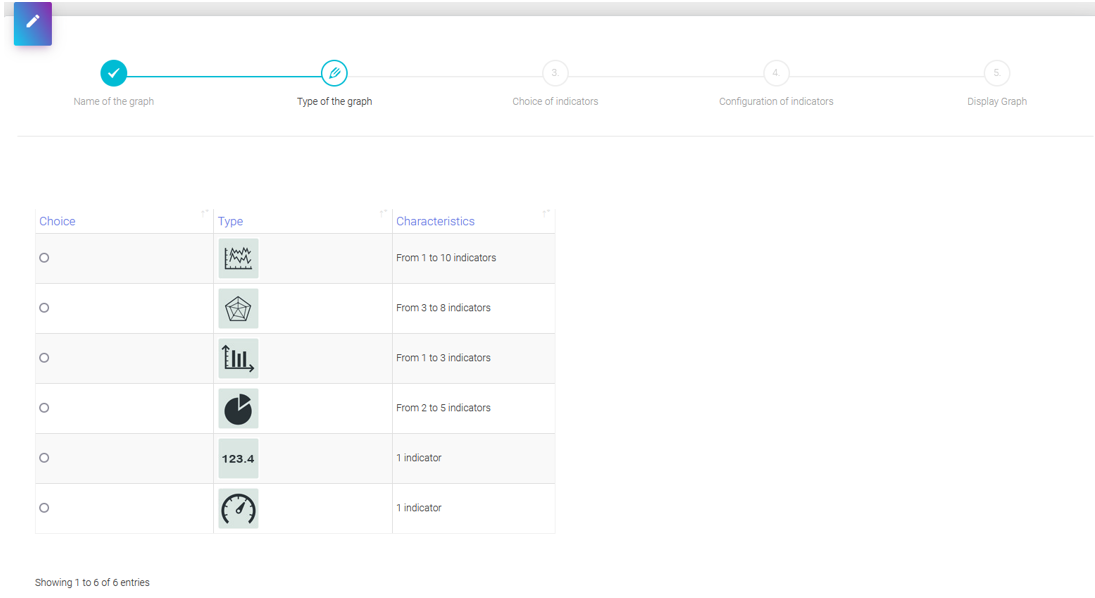
Step 2: Graphic type
Select the desired chart type with the radio button, then click Next.
The graphs, depending on their types, are limited in number of metrics for the sake of clarity in terms of representation.
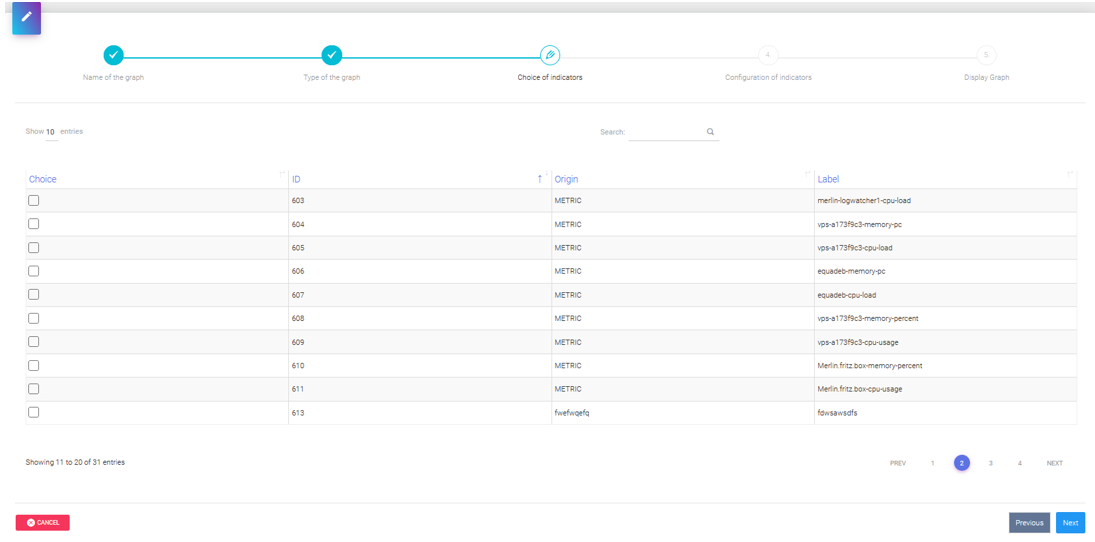
Step 3: Metrics attributes selection
You have access to all available metrics.
Select the metrics by checking the checkboxes, then click Next.
An error message is displayed if the number of checked metrics does not match the type of graph previously selected.
Step 4: Metrics configuration
You can enter a new label and change the color by clicking on it.

Only Value or Gauge type graphs allow the entry of a unit of measurement and a maximum representation value.
Once you have finished configuring the metrics, click Next.
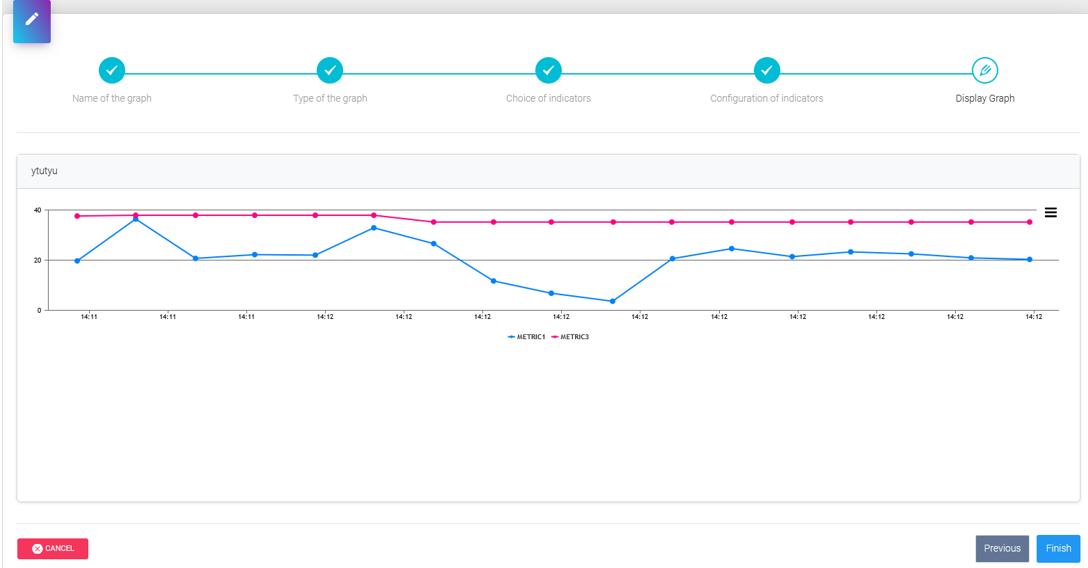
Step 5 : Display graphic
In this last step, the graph is displayed according to the settings that were made in the previous steps. You can thus visualize the final rendering. Data is displayed in real time for the last 10 sliding minutes.
Click the Finish button. To save the chart.
Delete a graphic
From the graphics list, you can delete a graphic using the red Delete button. You will be asked for confirmation.
Note
Please note, the graph is also deleted in the dashboard(s) in which it previously appeared.
Visualise a graphic
From the chart list, you can view a chart using the green View button.
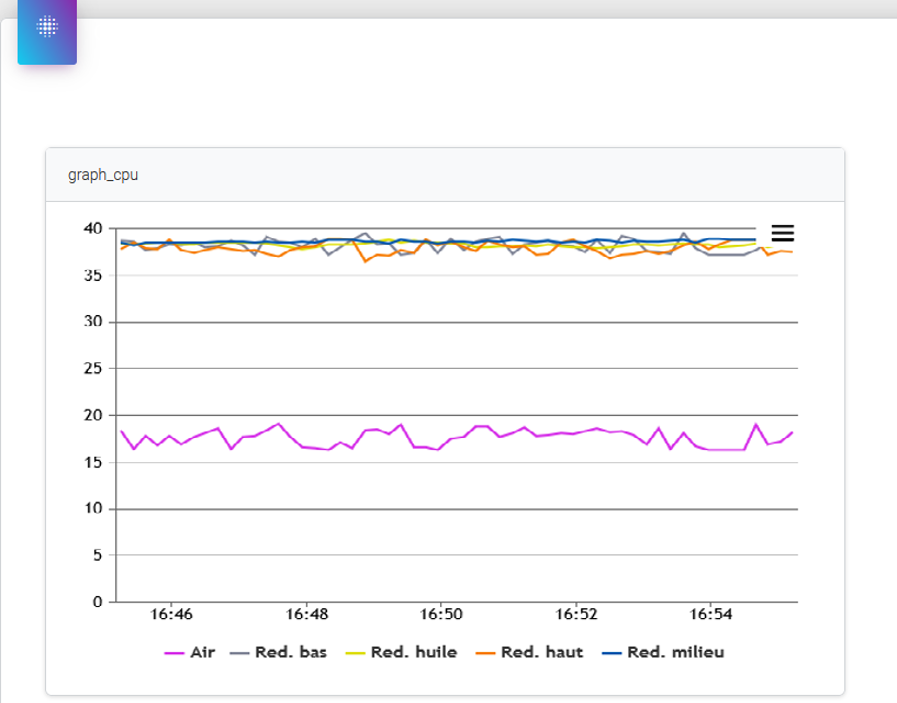
The visualization of a graphic is of real time type over the last 10 sliding minutes.
Each time new data is collected, it is automatically displayed on the graph.
The Close button returns you to the list of graphics.
The Export button allows export of the graphic.

