Overview
Funtional Architecture

LIKPI is a software solution that allows you to analyze and visualize in real time the data gathered from different log sources coming from your IT infrastructure or your business applications. LIKPI is fully scalable and able to manage several millions of messages per second.
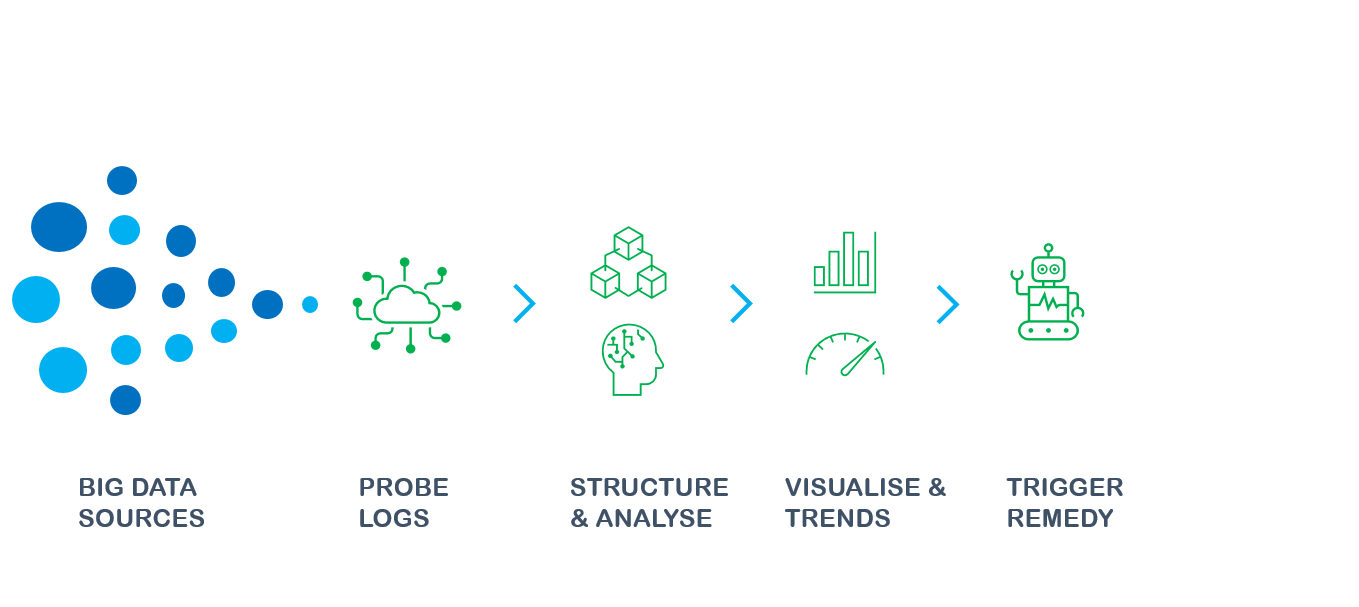
After the deployment of our observability agents to gather your logs, you will be able first to easily transform your streaming data in structured events, then query and build real time dashboards with your Key Performance Indicators.
The end users access the web application with a tenant concept. They can search any events, consume existing dashboards with trend KPIs or create their own.
You can also trigger on demand or on abnormalities detection thanks to our TrueCorrelation module with any automation.
With LIKPI, the Big data becomes accessible to anyone !
Business value
Big data analytics helps organizations to empower their vision in order to identify new opportunities.
However although big data analytics is widely considered as a key driver of marketing and business processes improvement, a solution able to manage a huge amount of incoming data flow, able to structure them properly in metadata and easily extract the values in real time with a good exploitability vector is really a challenge to find.
Likpi for Bigdata & Analytics has been designed from the begining with this underlying challenge !
With Likpi, you can easily manage:
- Several thousand of metrics and/or several millions of events per second
- Extract your Key Performance Indicators from the amount of data thanks to our powerful SQL Query Builder
- Detect in real time any side effect or abnormal situation and trigger a remedy
Likpi will lead you to smarter business moves, more efficient operations, higher profits and happier customers.
Likpi planning stages
The workflow below shows how to reach Likpi business values with real time dashboards composed with KPIs and remedy actions on abnormalities detection.

